How to generate a report for the actual resource usage over time compared to baseline work at the monthly level for a Project?
If a Project Manager wants to see trending resource usage to adjust the remaining work based on historical actuals, or remove the resource from the project if there is 0 work being billed; there are many ways to accomplish this. I would like to showcase two quick tips:
Option 1- Configure a View in MS Project
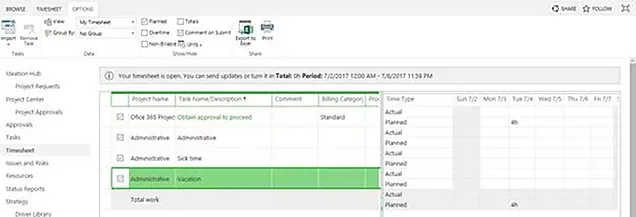
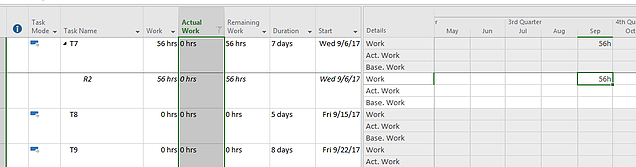
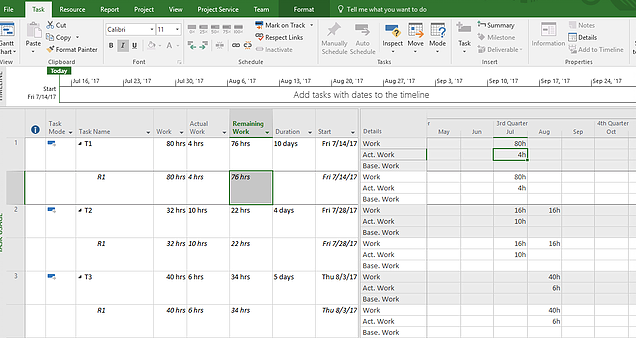
1. Open the Task Usage view on project file, actual resource usage over time compared to baseline work at the monthly level (3 tier of Timescale- Year, Quarter and Months)
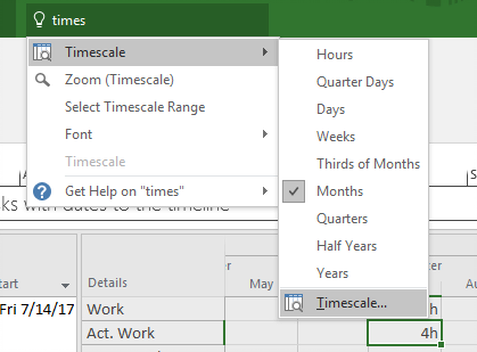
2. Open the Timescale by right clicking the Details pane or typing the Timescale in help section-
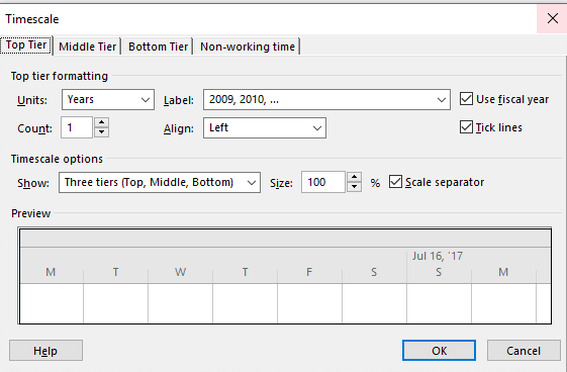
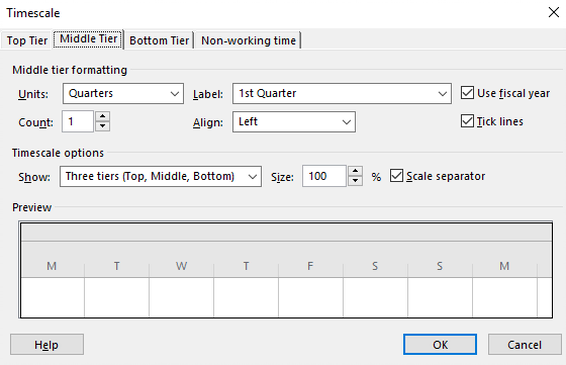
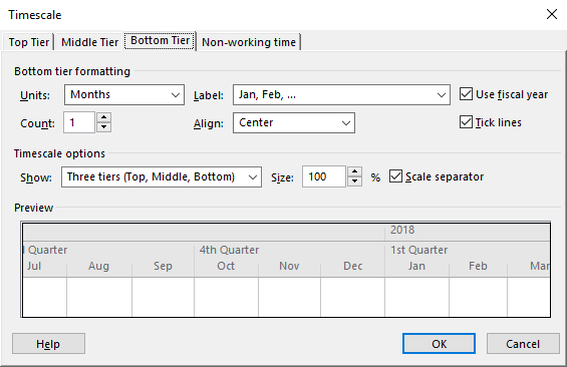
3. Modify the timescale for three Tier settings like below.
4. Create the filter - Remaining work, actuals, and Actual Work filtered by 0.
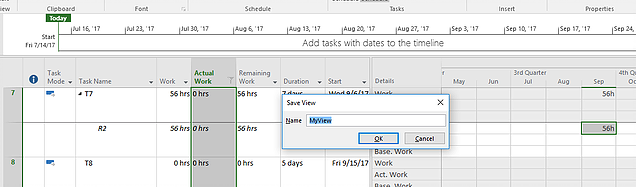
5. Save the view
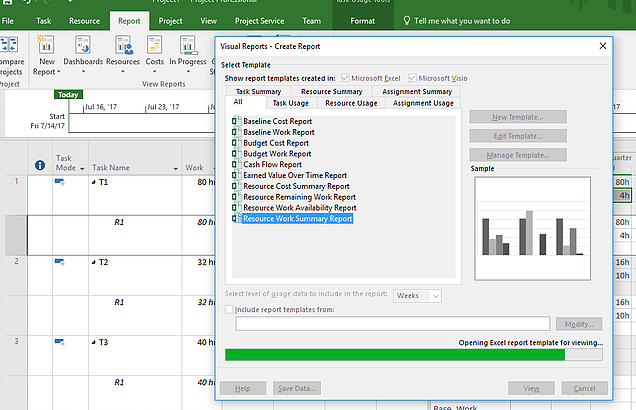
Option 2: Using the Visual Report in MS Project
Report > Visual Reports> Resource Work Summary and Click view, Generates the OLAP view of the project and you can configure the columns in Pivot table
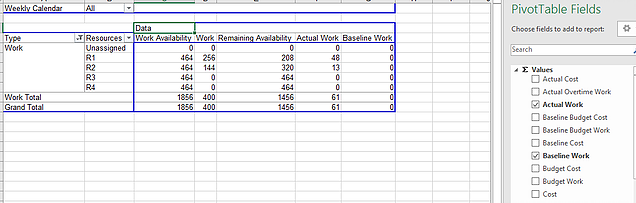
OLAP file is generated -
A Pivot report is generated, use the related columns as required.
Happy learning…
Best Regards,
Amit Khare
Director of Managed Services| MCC 2012/2011
Trusted IT Group | Cell : +1 847 340 5615 | email: amit.khare@trusteditgroup.com